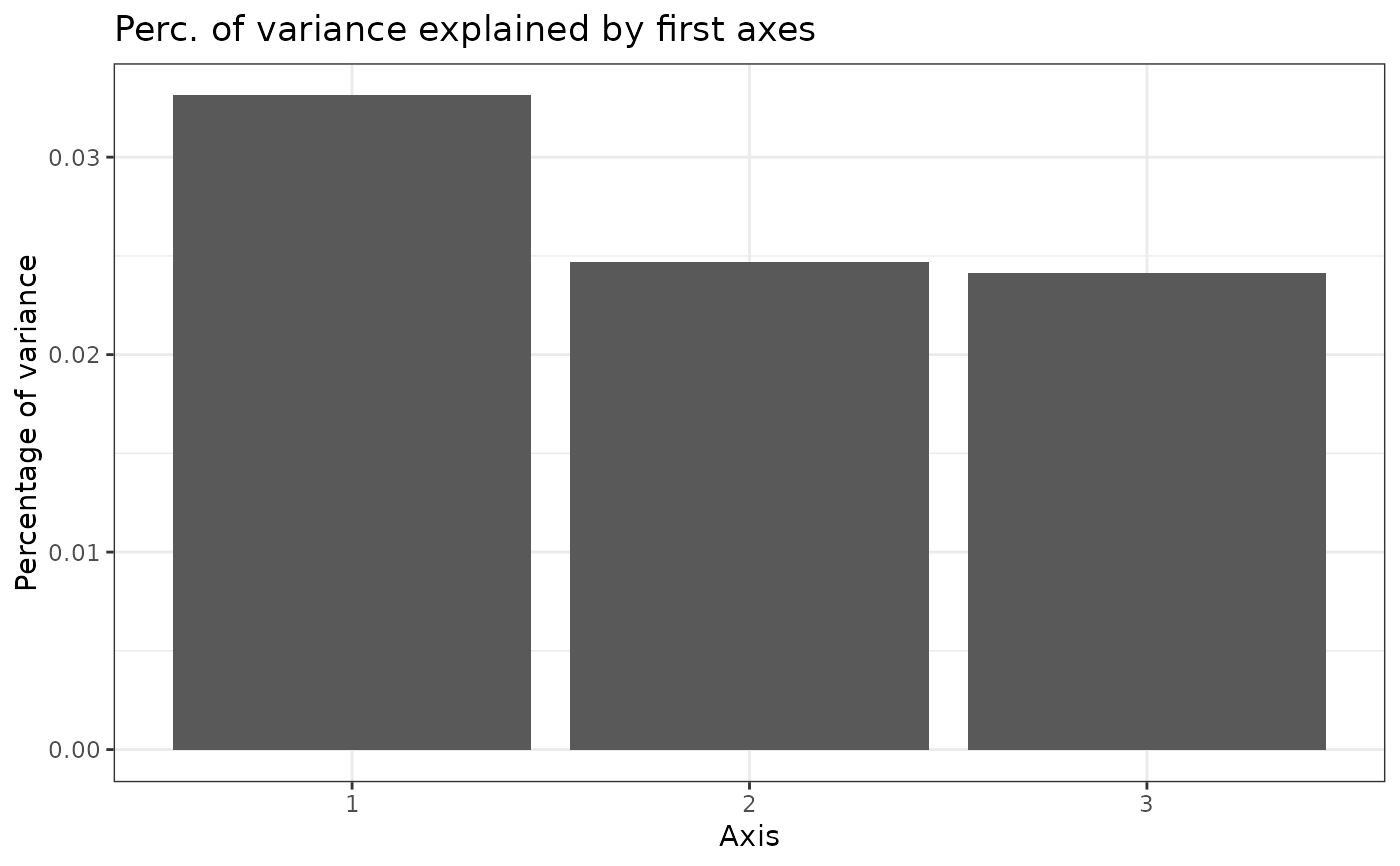
Plot variance explained by PCA axis
pca_varplot.Rd![[Experimental]](figures/lifecycle-experimental.svg) Compute variance explained by a few PCA axis
Compute variance explained by a few PCA axis
pca_varplot(x, naxe = 10)
Arguments
| x | glPCA object |
|---|---|
| naxe | number of axis for which you want to know explained variance |
Details
PCA from glPca
Examples
## simulate a toy dataset
x <- adegenet::glSim(50,4e3, 50, ploidy=2)
## perform PCA
pca1 <- adegenet::glPca(x, nf=3)
## Extract variance
pca_varplot(pca1, naxe=3)