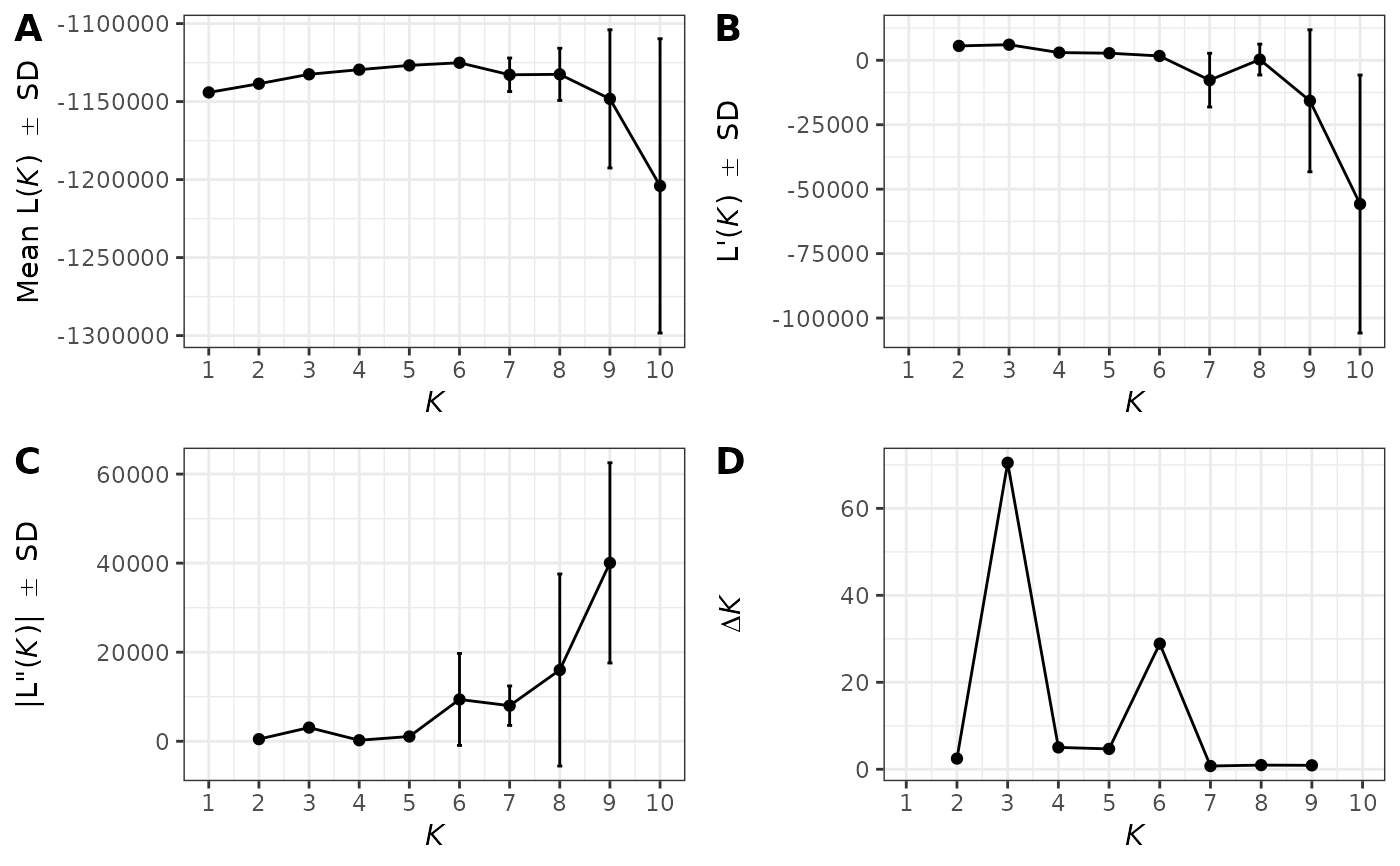
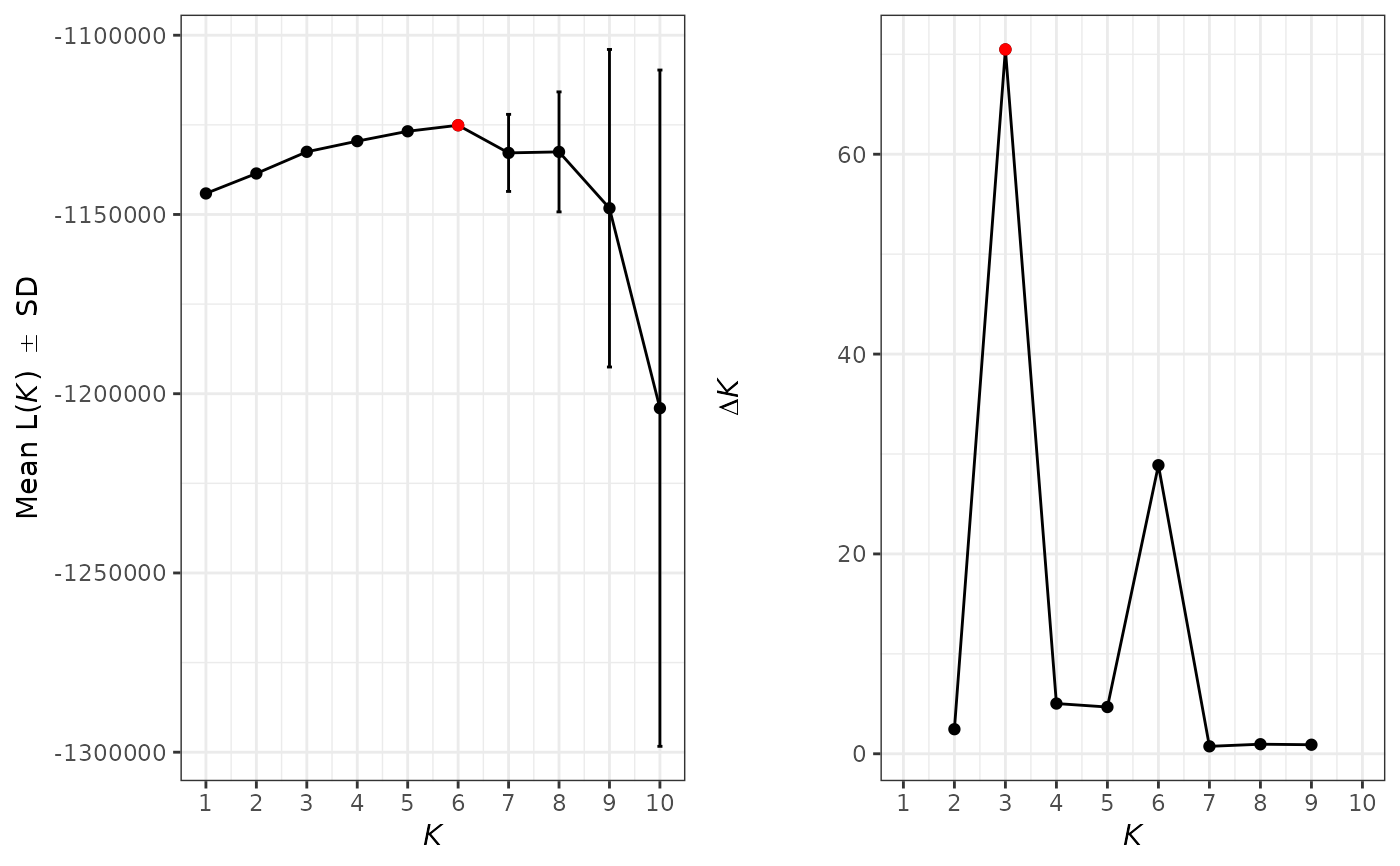
Compute Evanno
strc_evanno.Rd![[Experimental]](figures/lifecycle-experimental.svg) Compute classical Evanno from structure summary file and return a graphic
Compute classical Evanno from structure summary file and return a graphic
strc_evanno(df, plot = c("none", "full", "resume"), plot.max = TRUE)
Arguments
| df | Dataframe with structure results |
|---|---|
| plot | If it return a plot, with full view (4 panels) or all within the same figure |
| plot.max | in the graph, return the max value |
Details
more details to come ...
Examples
#> # A tibble: 6 × 8 #> run_id burnin iterations k ln_prob_data mean_llh var_llh mean_alpha #> <chr> <dbl> <dbl> <dbl> <dbl> <dbl> <dbl> <dbl> #> 1 k1_r1 10000 100000 1 -1144135. -1143901. 468. 0.003 #> 2 k2_r1 10000 100000 2 -1138700. -1137640. 2119. 0.512 #> 3 k3_r1 10000 100000 3 -1132514 -1130849. 3330. 0.388 #> 4 k4_r1 10000 100000 4 -1129568. -1126999. 5138. 0.231 #> 5 k5_r1 10000 100000 5 -1126832. -1123725. 6212. 0.234 #> 6 k6_r1 10000 100000 6 -1124766 -1121382. 6767. 0.232#> [1] "evanno" "plot.full" "plot.resume"# Different plot options res <- strc_evanno(strcSummary.data, plot = "full", plot.max = FALSE)res <- strc_evanno(strcSummary.data, plot = "resume", plot.max = TRUE)